Hello Traders,
Hope you all are doing good…
Financial year ended on 31st march and I have been looking at so many stock charts which have been on a downward spiral and there have been many quite a lot of them. Also there were few who convinced me to look at from a yearly perspective and showing some early signs of recovery which may continue in the coming year.
This Stock market Darling once caught my eye and I will elaborate it in detailRead more: Can This Stock Give 56% Return In One Year?
Stock Name : Aurobindo Pharma View :Bullish

Monthly chart of Aurobindo Pharma source: tradingview
- In the above Monthly Chart of aurobindo pharma, we can see the stock made a bottom of 288.85 in march 2020 and recovered to 1063.90 in a years time by may 2021 (more than trippled in 14 months)
- We can see the stock found it difficult to close below 408 in march 2020 despite there were long shadows to the monthly candles of march and april 2020. The long shadows indicate that the stock is witnessing a strong buying at lower levels and stock rising from the lows.
- in recent two months this has happened for the first time since may 2021 that the stock has shown positive closing for two consecutive months, look at the last two green candles showing some buying interest getting generated exactly around the level of 408 (stock not closing below 408)

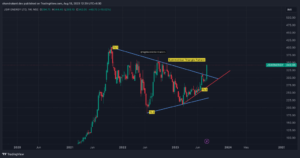
Weekly chart of Aurobindo Pharma source: tradingview
In the above weekly chart,
- The stock has closed successfully above the white line EMA 20 for three weeks consecutively
- Look at the indecisive red candle after which the stock saw a sharp recover and decided to rise from that level of 412 and rallied as high as 1063
- If we connect the two points Peak point A and the outer high point B we get the red descending trendline above which the stock has successfully close for 3 weeks
- As we plot fibonacci retracement levels at the peak and the recent bottom, we get 3 handsome levels 654 which is 38.20 percent retracement, 733 which is 50% retracement and 812 which is 61.80% retracement, all of these levels can be considered as potential targets in the year to come.
- However a close below the point C i.e. 412 will change the view of the stock, however it looks 412 will play a strong support going further
- @ 61.80% retracement if the stock touches 812 it can be considered as 56% return on stock from current level of 518 and stop loss below 412 which is approximately 3:1 Reward to risk.
Hope you like it,
Trading Mantra:
“Defining your style and objectives makes it much easier to stick to your strategy”. ~Mark Minervini
Happy Trading…..
Be A Wealthy Trader…..